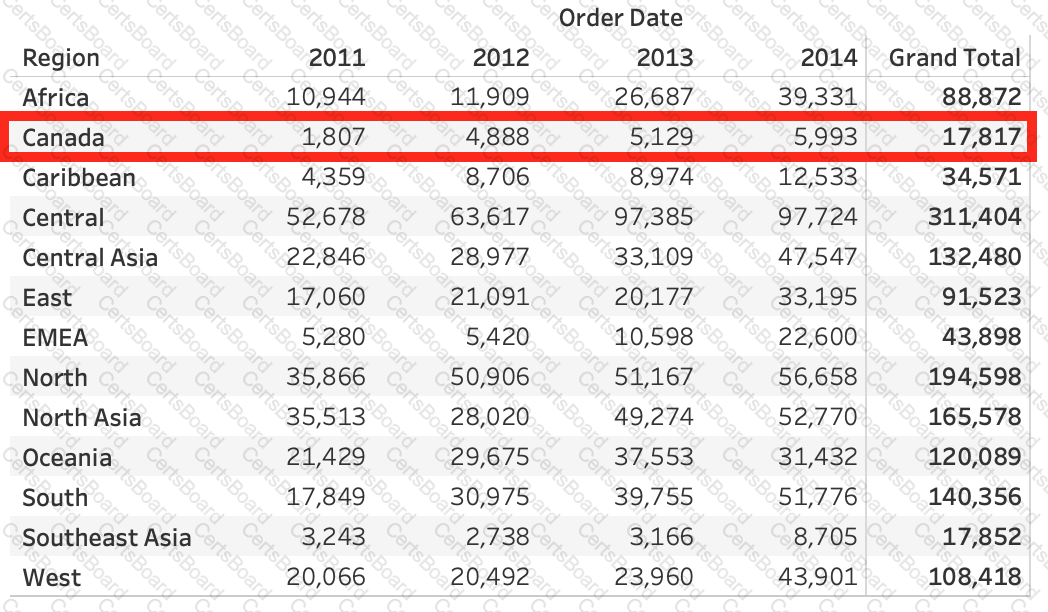
Using the dataset provided, create a crosstab showing the Profit of each Region per Year, then add grand totals to the view. What was the total Profit for Canada in 2012 and the total Profit for Canada for 2011 through 2014, respectively?
To connect Tableau to a CSV data source what type of connection should you use?
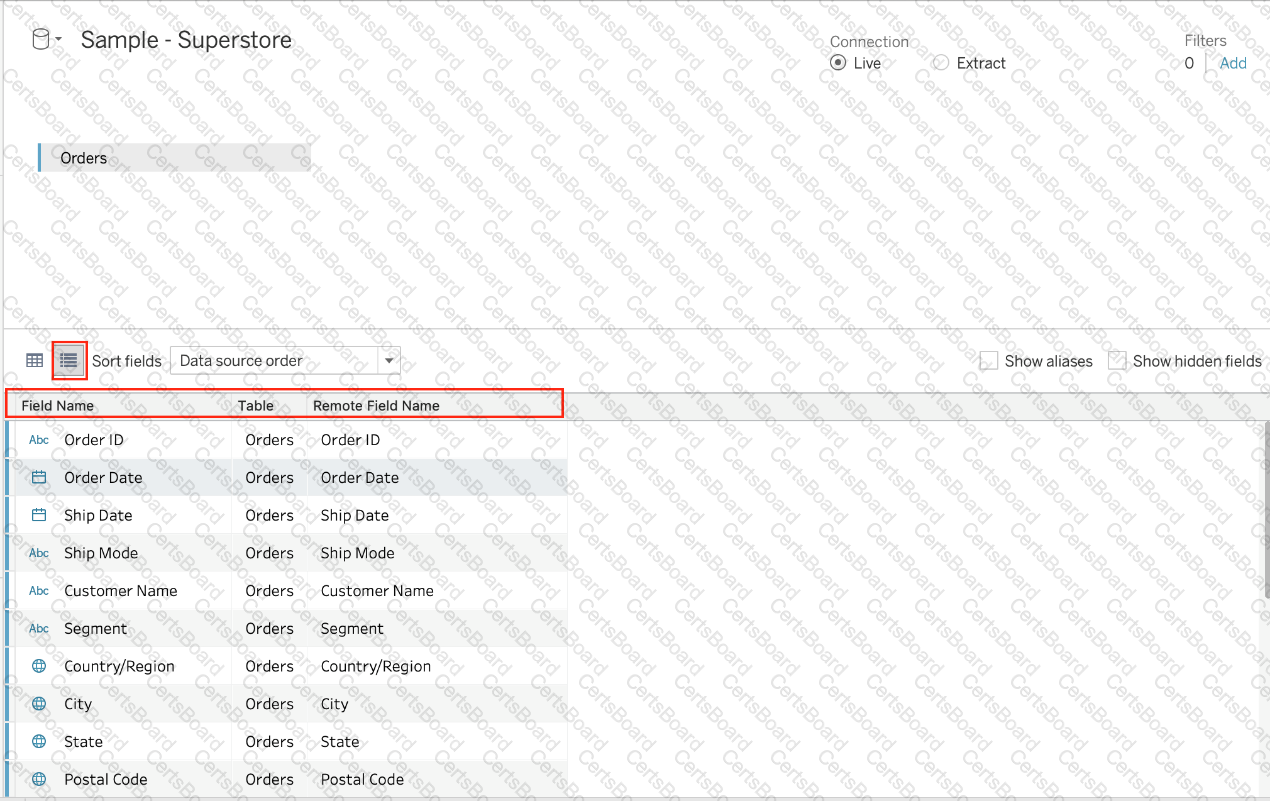
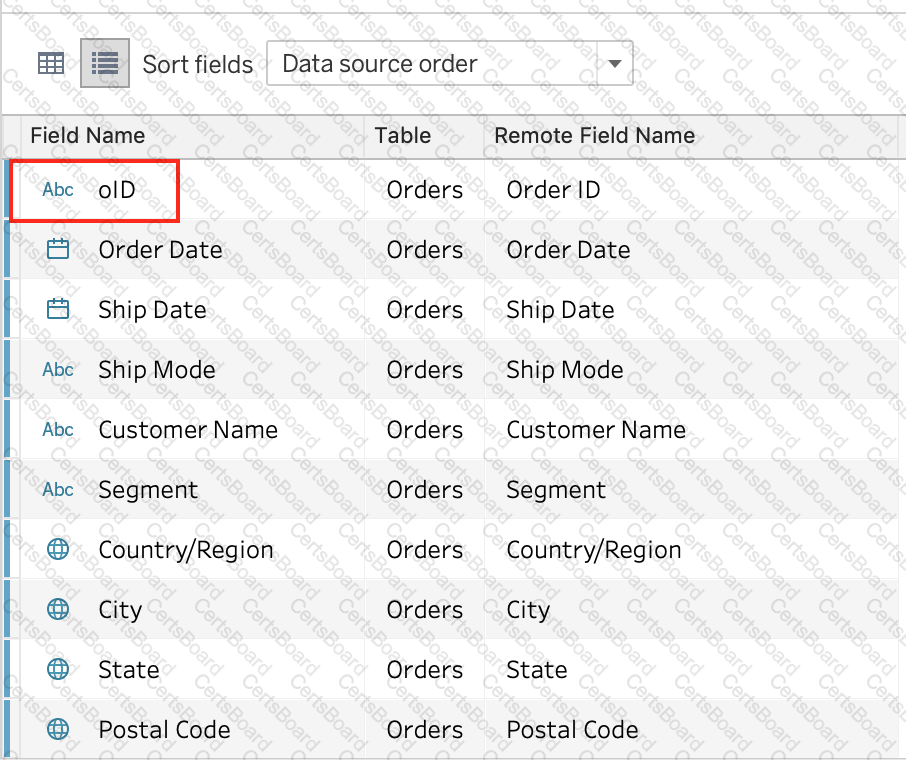
When using the manage metadata option, we can create custom names for columns where _____________ is the original name of the column whereas _____________ is the custom name we created in Tableau.
Using the Time-series table, create a cross tab showing the Sales for each Item Number-ID, broken down by Assortments, then add Grand totals to the view. Which Item Number ID made the maximum sales across all assortments?
When you drop a continuous field on Color, Tableau displays a quantitative legend with a ___________ range of colors.
True or False: We can disaggregate the data, to see all of the marks in the view at the most detailed level of granularity
Which two analytics options are available for a scatter plot view? Choose two.

TESTED 10 Jul 2026